Shooting Star is a single candlestick pattern that occurs at the end of an uptrend and mostly it starts a new downtrend. It is a bearish reversal pattern so the chances that it can change a trend are very high if it forms at the right location. If you follow this pattern on charts then you can spot many of them but trading all of them will not give you very good accuracy. We will discuss this in detail.
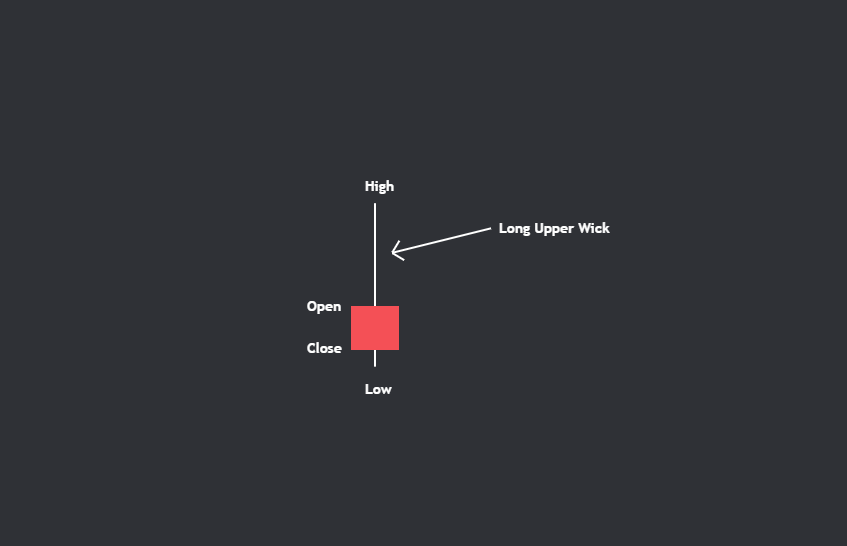
First, it’s important to understand why a shooting star candle is formed. During an uptrend, buyers remain very active and on every pullback, they buy more. But there comes a zone where bears are waiting to enter and they outnumber the buyers making the price close near the open of candle and hence a large upper wick generally greater than twice the size of the body is formed.
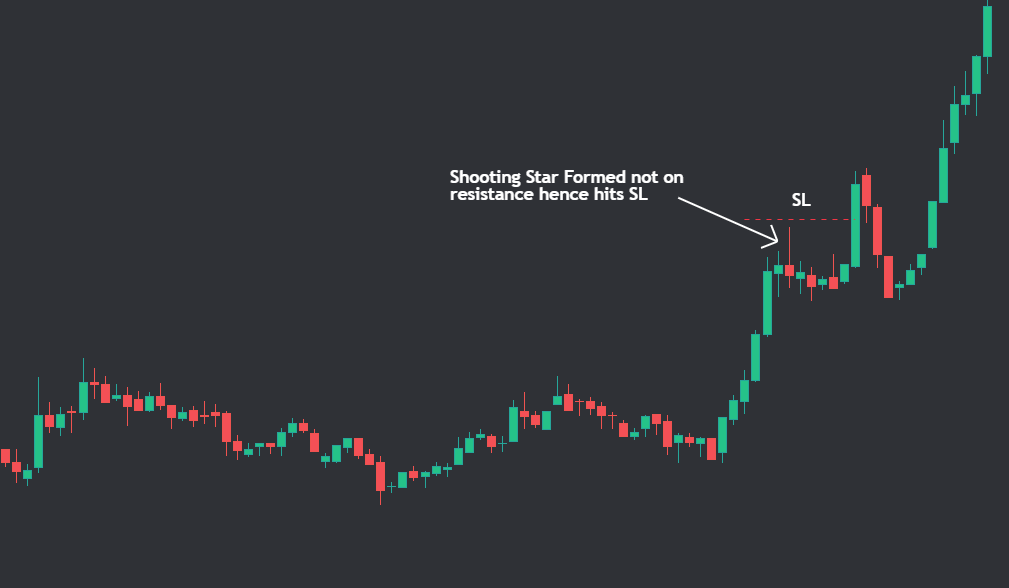
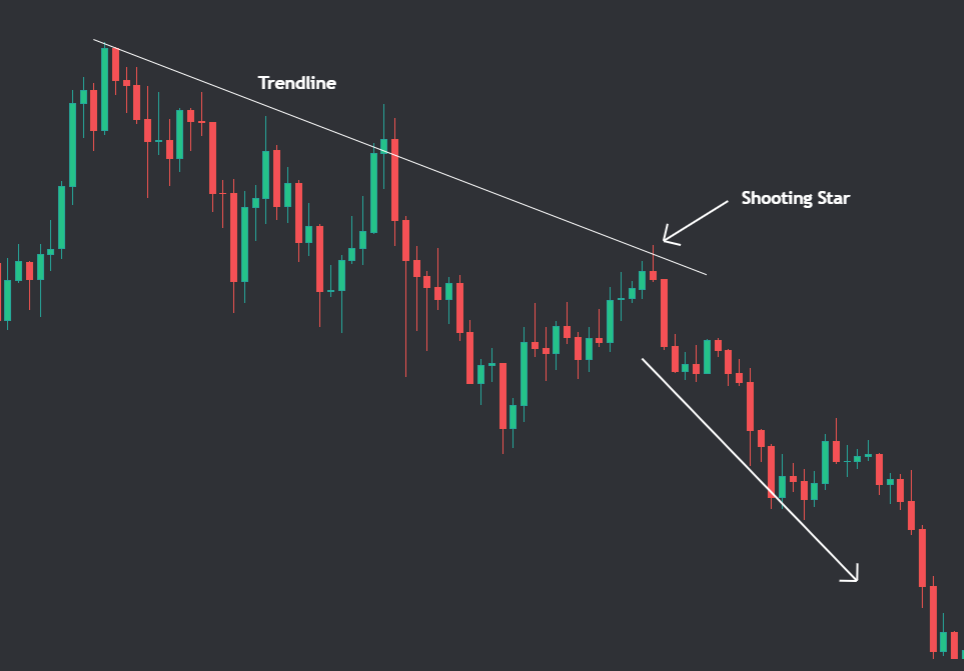
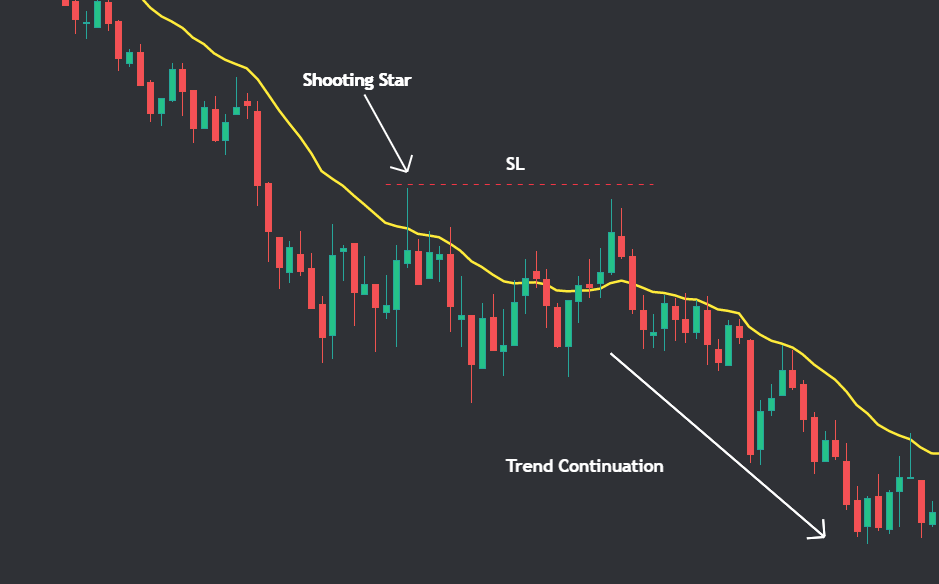
Note we mentioned a zone where bears become active. This zone is mainly support and resistance and that’s why relying just on a shooting star pattern that forms anywhere in charts might not be a good idea. Support and resistance can come from previous swing high, Trendline, ema, and Fibonacci retracement. There is much other complicated stuff in technical analysis but sticking to basics can also give you good trades.
How to trade shooting star candles?
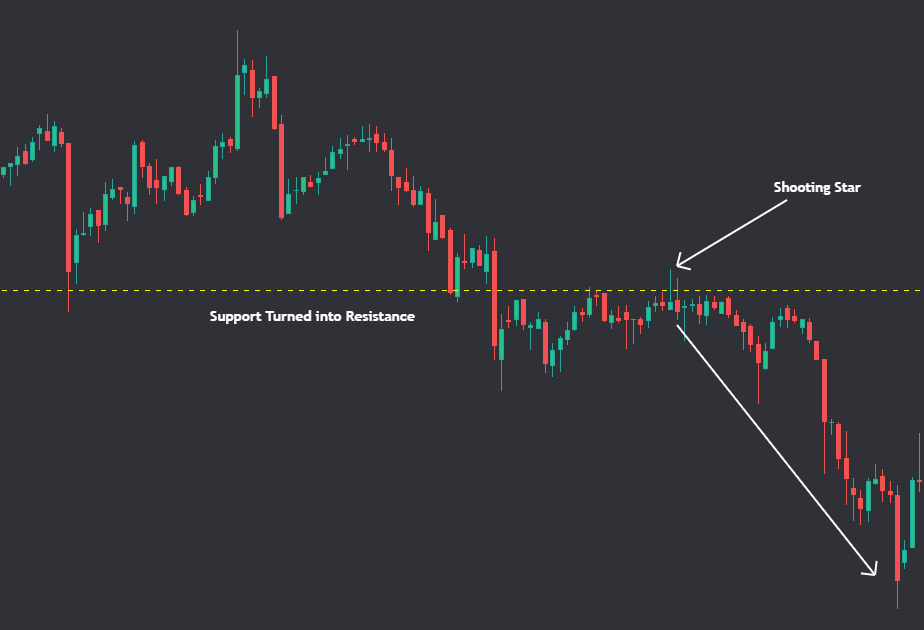
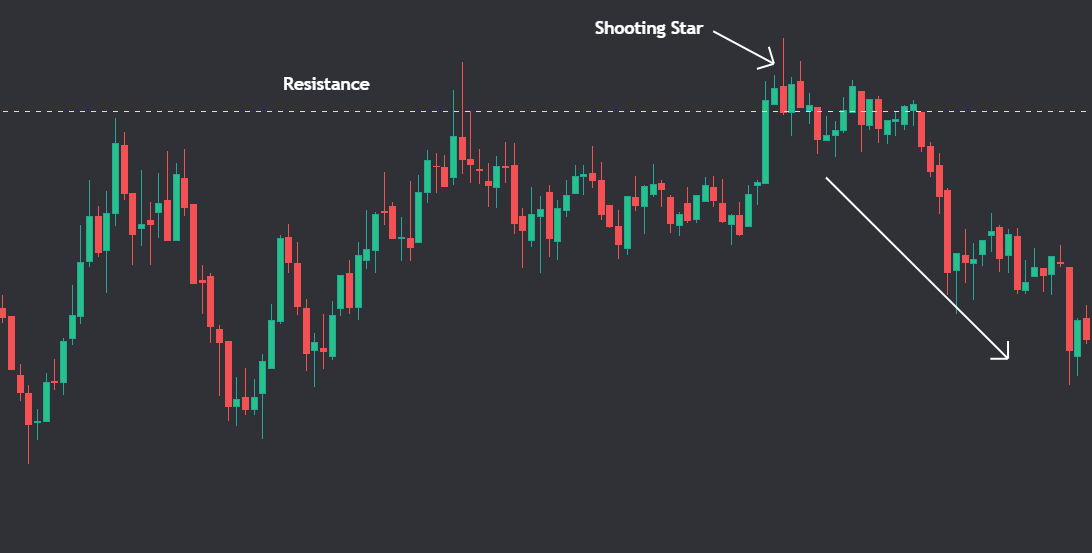
Even after the shooting star candle is formed traders should wait for a red confirmation candle. When you trade shooting star on the resistance you can get a very good risk to reward trade.
Let’s see some examples.
Multiple Timeframe analysis of Shooting Star candle.
For Serious Readers: If you are reading this till now then we’ll share a very secret strategy that very few people follow.
Doing multiple timeframe analysis on shooting star candles can increase your probability of winning. What we see as an uptrend in a lower timeframe can just be a correction of a downtrend in a higher timeframe. Here’s what we mean.
Suppose there is an uptrend going on in a 5m timeframe and a shooting star is formed on the resistance area during this timeframe. But if we switch to a higher timeframe like hourly then this is just a correction move for a downtrend. So this shooting star has maximum chances of working as we are looking for reversal and we are also with the trend. Going with the trend can help massively as we have a very small stop loss and a very good risk-to-reward ratio.
FAQ:
Best shooting star candlestick pattern scanner?
We at scan a trade made a crypto screener that scans all timeframes for hammer and shooting star candlestick pattern that forms on support and resistance. It sends real-time alerts on our discord server. You should check it out.
When do I use a shooting star candlestick?
The Shooting star candlestick pattern is a reversal candlestick pattern that can give a very good risk-to-reward ratio for a short trade. It becomes more effective when it’s formed at resistance.
How do I identify shooting star candlestick?
You can recognize a shooting star when a candle has a larger upper wick and a very small body at the bottom.
When do I use a shooting star candlestick?
You can use a shooting star when you are looking for a shorting opportunity and a reversal trade.
What is the difference between a hammer and a shooting star pattern?
A hammer is formed at the end of a downtrend while a shooting star is formed at the end of an uptrend.