Hammer is a single candlestick pattern that occurs at the end of a downtrend and mostly it starts a new uptrend. Is it a bullish reversal pattern so the chances that it can change a trend is very high if it forms at the right location. If you follow this pattern on charts then you can spot many of them but trading all of them will not give you very good accuracy. We will discuss this in detail.
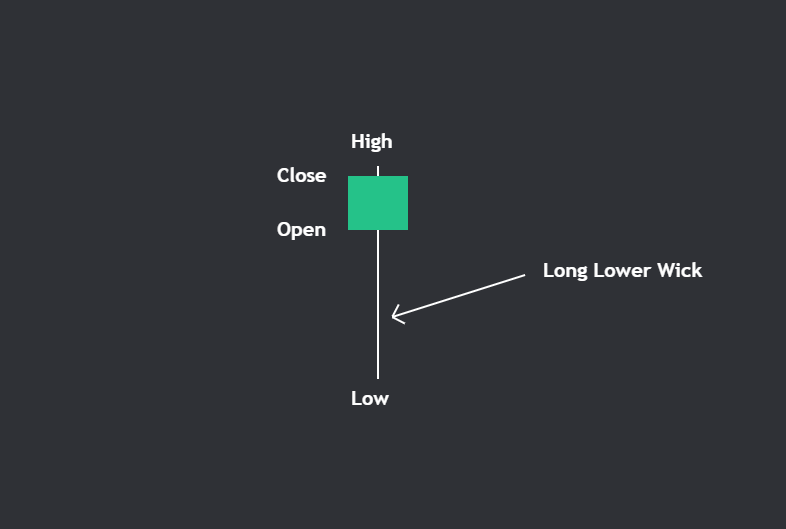
First, it’s important to understand why a hammer candle is formed. During a downtrend, sellers remain very active and on every pullback, they sell more. But there comes a zone where bulls are waiting to enter and they outnumber the sellers making the price close near the open of candle and hence a large lower wick generally greater than twice the size of the body is formed.
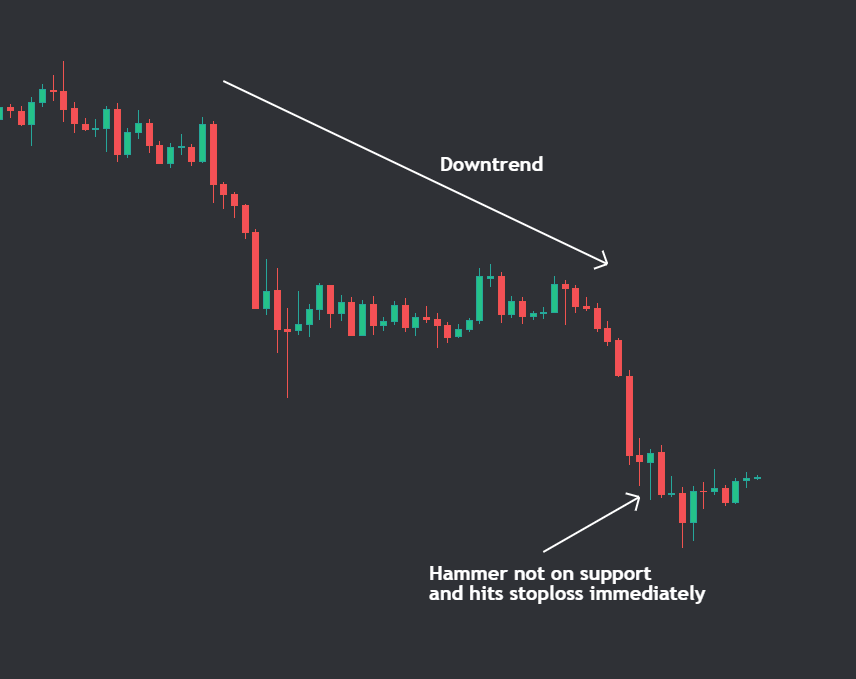
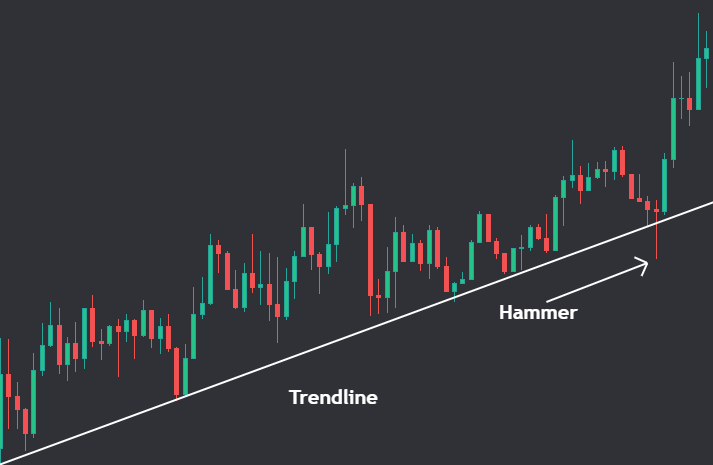
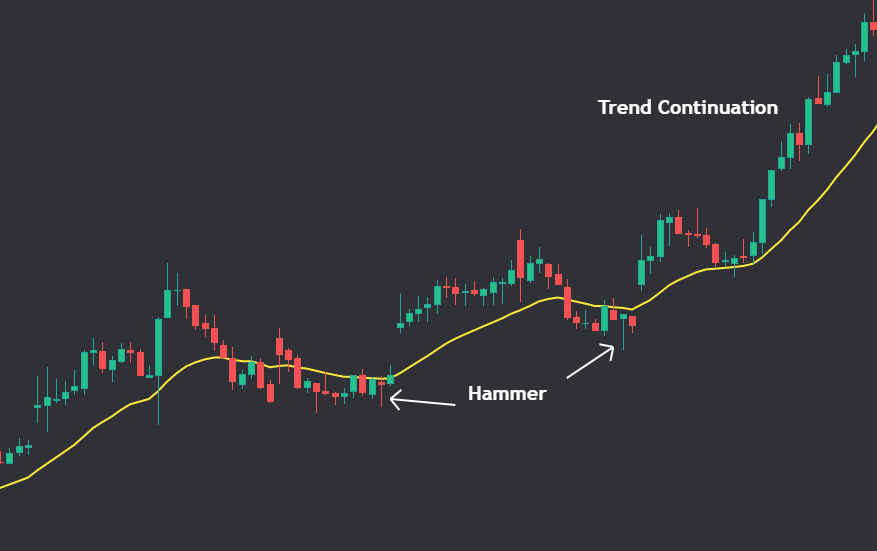
Note we mentioned a zone where bulls become active. This zone is mainly support and resistance and that’s why relying just on a hammer pattern that forms anywhere in charts might not be a good idea. Support and resistance can come from previous swing low, Trendline, ema, and Fibonacci retracement. There is much other complicated stuff in technical analysis but sticking to basics can also give you good trades.
How to trade hammer candles?
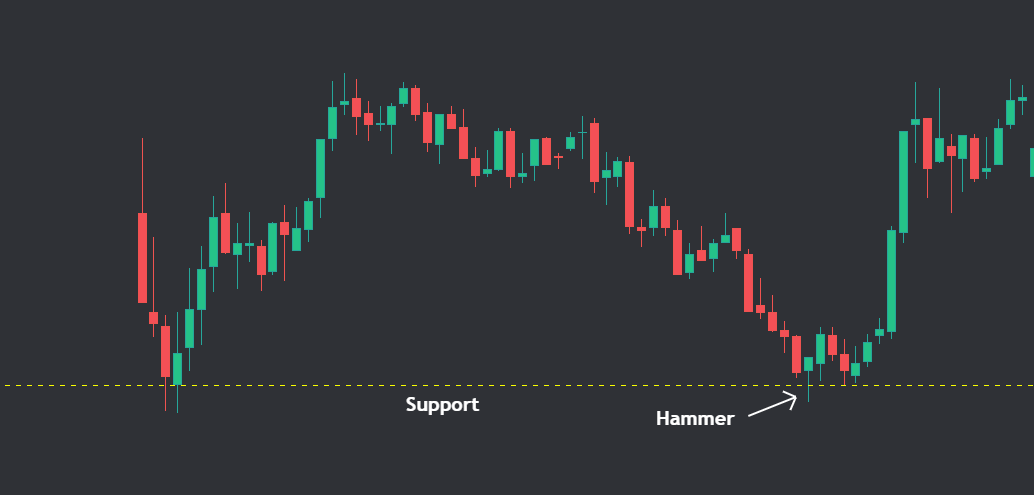
Even after the hammer candle is formed traders should wait for a green confirmation candle. When you trade hammer on the support you can get a very good risk to reward trade.
Let’s see some examples.
Multiple Timeframe analysis of hammer candle.
For Serious Readers: If you are reading this till now then we’ll share a very secret strategy that very few people are following.
Doing multiple timeframe analysis on hammer candles can increase your probability of winning. What we see as a downtrend in a lower timeframe can just be a correction of an uptrend in a higher timeframe. Here’s what we mean.
Suppose there is a downtrend going on in a 5m timeframe and a hammer is formed on the support area during this timeframe. But if we switch to a higher timeframe like hourly then this is just a correction move for an uptrend. So this hammer has maximum chances of working as we are looking for reversal and we are also with the trend. Going with the trend can help massively as we have a very small stoploss and very good risk-to-reward ratio.
FAQ:
Best hammer pattern scanner?
We at scan a trade made a crypto screener that scans all timeframes for hammer and shooting star candlestick pattern that forms on support and resistance. It sends real-time alerts on our discord server. You should check it out.
What is a bullish hammer candle?
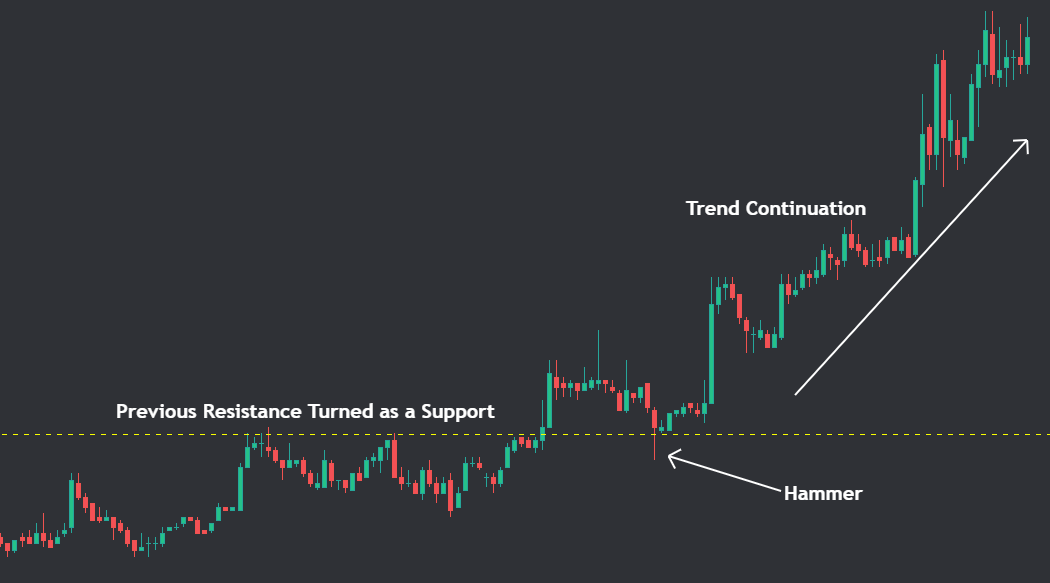
A bullish hammer candle is formed at the end of the downtrend and it makes the trend change and starts an uptrend. A bullish hammer candle can also be formed as a bullish continuation pattern created on trendlines or moving averages.
What is a red hammer candlestick pattern?
The color of the hammer pattern is mostly insignificant. Important is how it is formed and how long is the wick. Hammer is formed when bulls take control of bears making prices rise with very strong momentum in the same timeframe.
What is a Double hammer pattern?
A double hammer pattern is formed when after the first hammer candle sellers again take the lead and takes prices lower again while after that bulls are also not easily giving up and thus makes two hammers pattern. Traders should wait for confirmation of bullish candles.
Is a hammer candlestick bullish or bearish?
Hammer candlestick is always a bullish reversal pattern as it is mostly formed at the end of a downtrend.
How do you trade a hammer candlestick?
Hammer is a bullish reversal candlestick pattern so traders should always combine it with other reversal trading systems like rsi divergence. Also always wait for confirmation bullish candle as many times a hammer candle also fails and the downtrend continues.
What does the hammer pattern indicate?
Hammer Candlestick pattern clearly indicates that bulls outnumbered bears and hence they made prices rise in momentum and hence it indicates that a reversal is about to happen and the stock will start its uptrend.
What is the difference between a hammer and an inverted hammer?
Hammer has a lower wick while the inverted hammer has an upper wick. They both act as a bullish reversal pattern and mainly form at the end of a downtrend.
When not to trade Hammer candle pattern?
You should not trade based on any candlestick pattern when there is a piece of strong news going around that asset because during high volatility periods like news or any other major event the effect of technical analysis dries up hence avoid trading with candlesticks during those periods.