With the proper understanding of chart patterns you can easily identify market behavior and you can also combine it with your analysis to make a good unique trading system. In this article, we will discuss some of the best ways to trade some of the most important candlestick patterns. You will also get a complete idea of where to place your stoploss.
What is a Candlestick pattern?
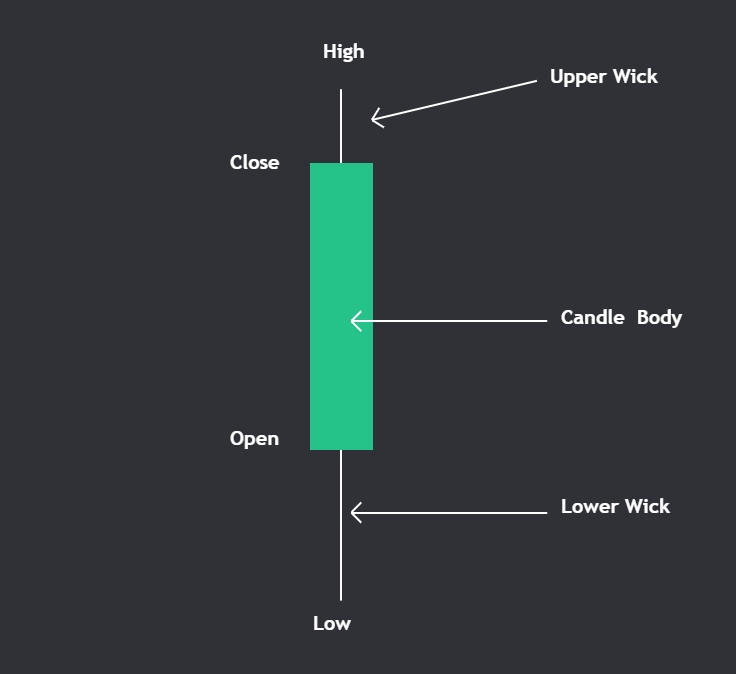
For this, you have to first understand what are Candlesticks. A single Candlestick basically means Opens, High, Low, and Close values of a particular timeframe. Candlesticks have two parts body and wicks.
The body is a solid rectangle and it represents the difference between open and close While the wicks are the vertical line and represent high and low values of every candlestick.
Let’s see an example
The body-to-wick ratio determines how strong that candlestick is. If more than 60% of the candle is covered with the body then it’s a strong candle. A green candle means bullish strength and a Red candle means bearish strength.
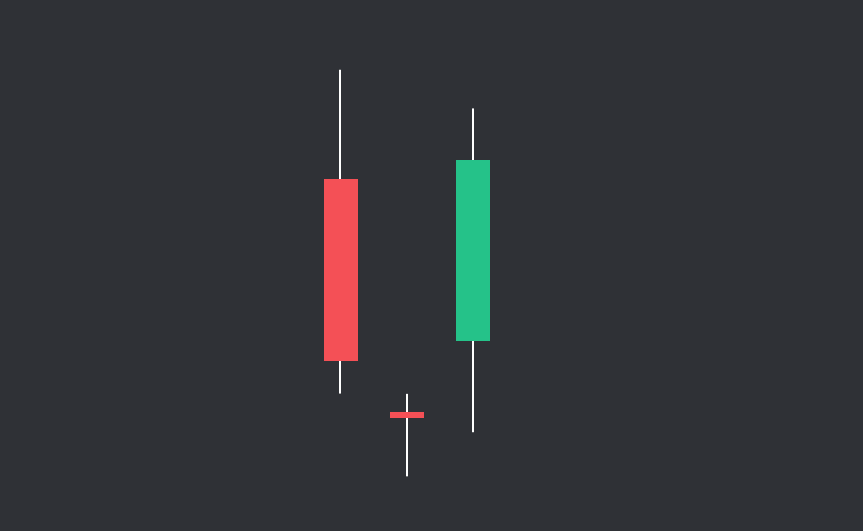
In technical analysis Candlestick chart patterns are formed by combining one or more Candlesticks. For example, let’s suppose a small red candlestick is fully covered by a green candlestick then it clearly means that bulls are stronger than bears and we can look for upside momentum trades.
Before we continue let’s focus on some important points:
-
If you look at any candlestick chart you can spot many patterns but we are not trading all of them. We trade only those patterns that form at a very specific important level like support and resistance, ema’s, and trendlines.
-
Even Though candlestick patterns are very powerful on their own but we can’t expect them to work always. As candlestick pattern and price action works great when combined so, We should always combine them with our own analysis of trends to increase our probabilities of winning.
-
Never trade with Candlesticks patterns when the price is stuck in a range or starts consolidating, wait for the price to break that range and then observe closely at the candlesticks that break the range. Also, don’t trade when some major news is going on in that asset. As it can lead to many false signals so wait for the price to settle down in this case.
Now, we will discuss in detail with examples how some important candlestick chart patterns with some additional analysis can yield great results.
Types of Candlestick patterns
-
Continuation Patterns: They occur mostly in a trending market when markets take a pause for some time, consolidate, and again start trending in the same direction. A bullish continuation pattern occurs in an uptrend while a bearish continuation occurs in a downtrend.
-
Reversal Patterns: They are formed when the trend is just about to change. The formation of these patterns signifies that bull or bears have lost their steam. A Bullish reversal pattern occurs at the end of a downtrend when sellers are unable to move the price further downward. Similarly, a Bearish reversal pattern occurs at the end of an uptrend when Buyers are unable to move the price further upward.
Note: When trading reversal patterns always check for prior price action and the location of the candlestick pattern. A Reversal pattern forming at support and resistance can have more impact and higher chances of working. It’s better to avoid any reversal or continuation pattern that is forming inside of consolidation.
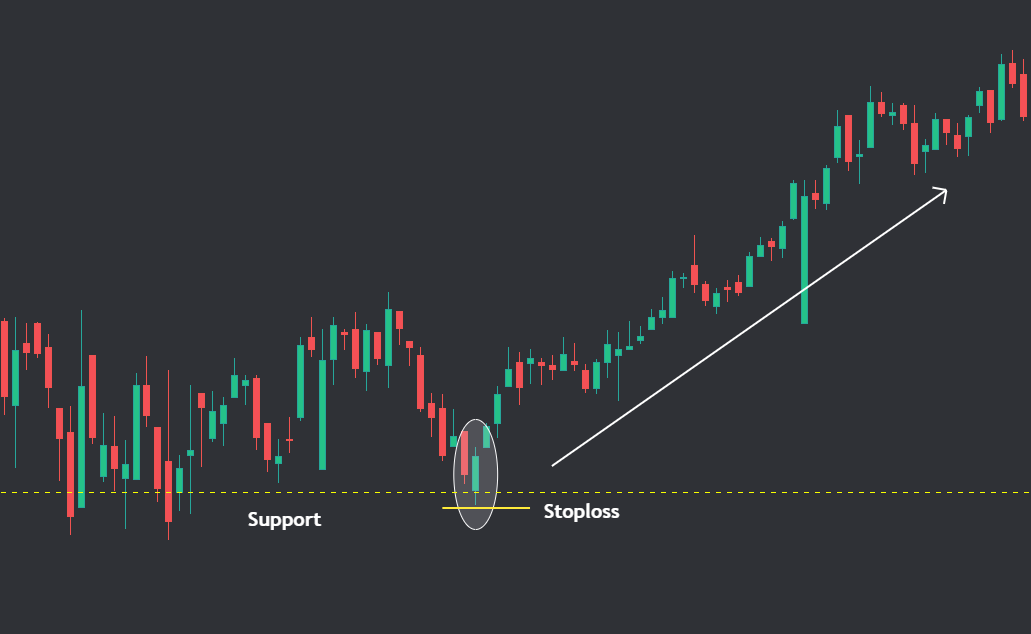
1. Hammer.
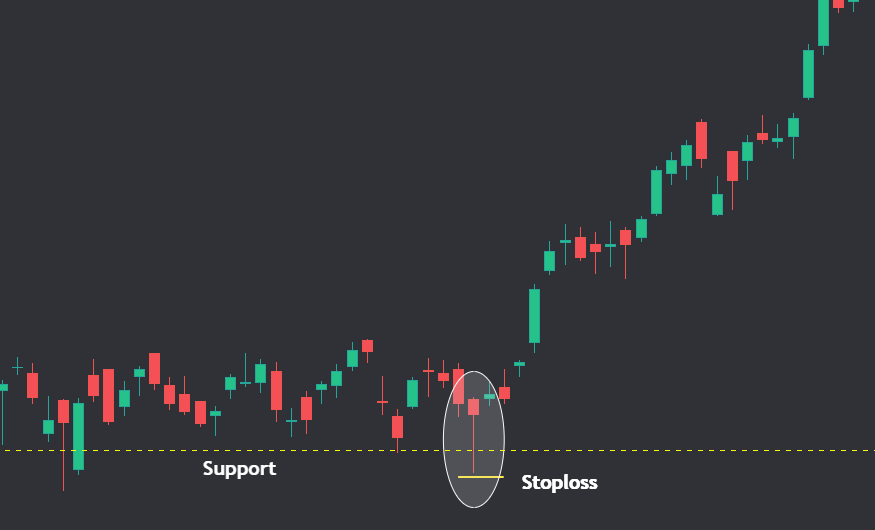
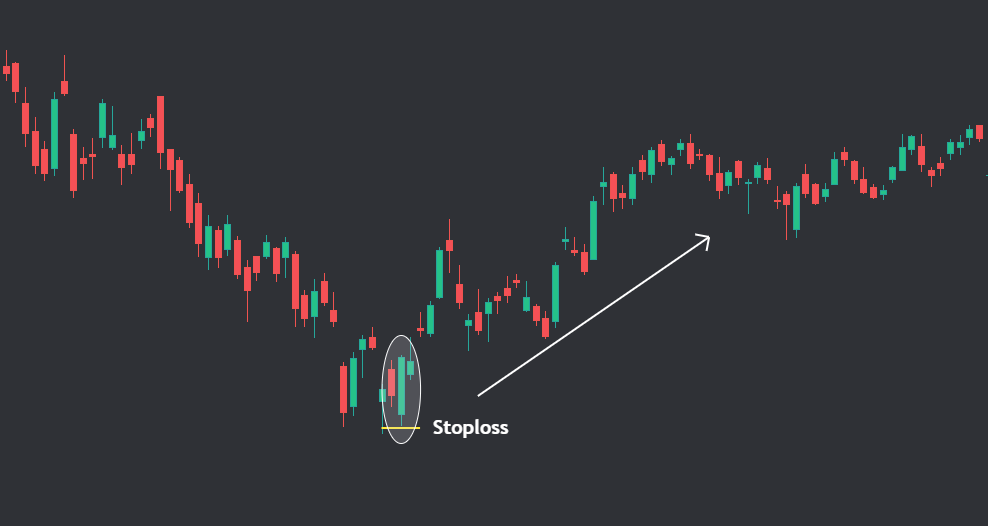
Hammer is a bullish reversal pattern that forms at the end of a downtrend and it is a single bullish candlestick pattern. It has a very small body located at the top of the candle with a body twice the length of the wick. It forms when the candle opens and sellers take the price lower than the seller starts to run out of steam and buyers kick in and they take prices very near to the opening price thus forming a hammer candlestick pattern.
While trading with a hammer pattern, always look for the next bullish confirmation candle and check if it forms at support. This will increase your chances of winning. The best place for stoploss is the low of hammer candle.
Let’s see a real-life example:
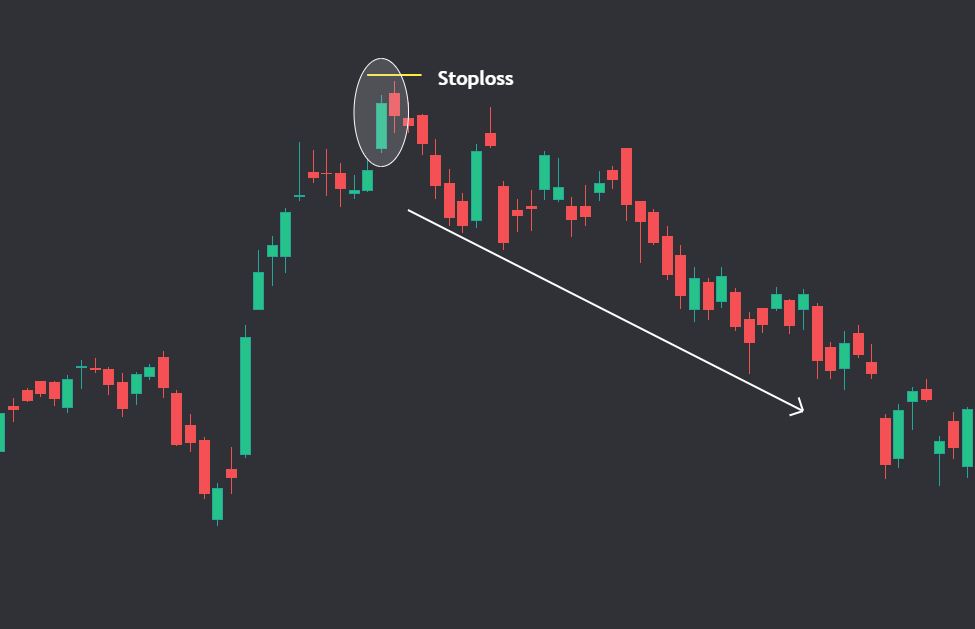
2. Shooting Star.
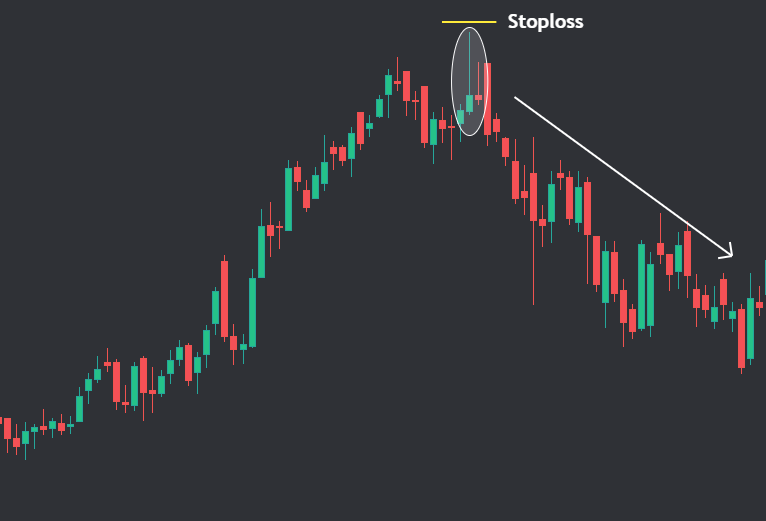
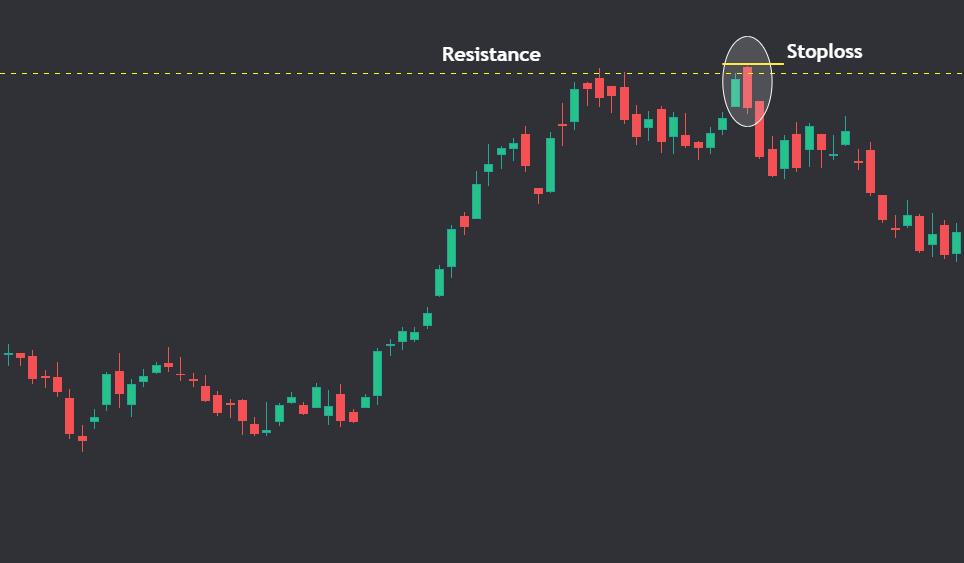
Shooting Star is a bearish reversal pattern that forms at the end of an uptrend and it is a single bearish candlestick pattern. It has a very small body located at the bottom of the candle with a body twice the length of the wick. It forms when the candle opens and buyers take the price higher than the buyers start to run out of steam and sellers kick in and they take prices very near to the opening price thus forming a Shooting Star candlestick pattern.
Similarly, while trading with a Shooting Star pattern, always look for the next bearish confirmation candle and check if it forms at resistance.. This will increase your chances of winning. The best place for stoploss is the high of Shooting Star candle.
Let’s see a real-life example:
Self Promotion: We have built a Crypto scanner for support and resistance rejection that scans Binance Crypto futures symbols. If you are interested, you can check it out.
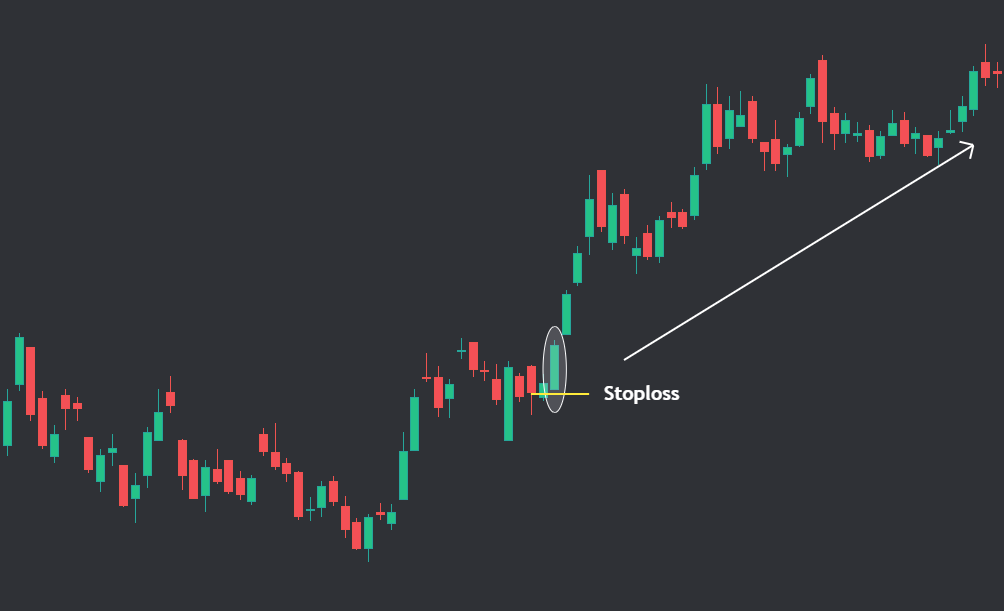
3. White Marubozu.
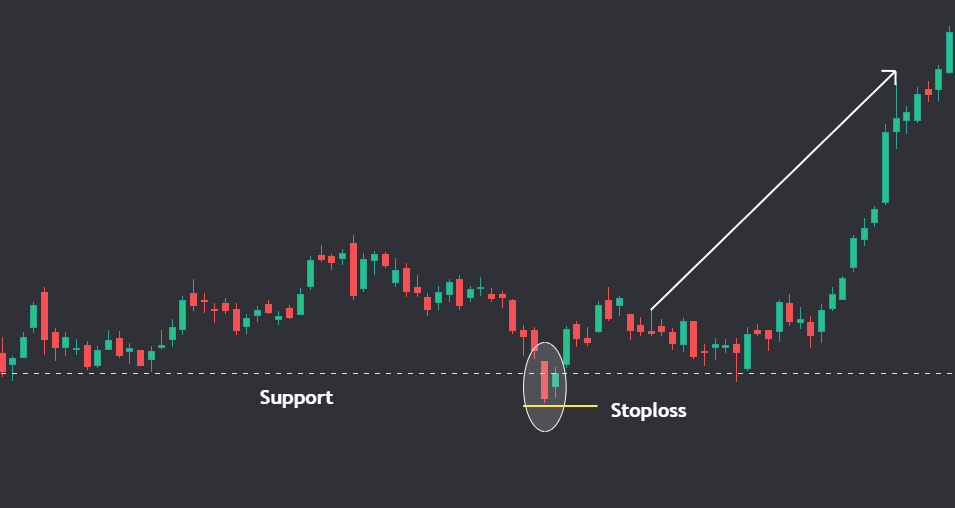
White Marubozu is a single bullish candlestick pattern and this candle acts both as a bullish reversal pattern and as a bullish continuation pattern. It is formed when the price opens and directly starts rising without any low formation and directly closes at the high of the day. The body of this pattern is above 90% of the full candle range so a very short wick or no wick at all can be seen in the White Marubozu candlestick pattern.
A very high-volume Marubozu candle is very powerful as it confirms that buyers are creating pressure on sellers. Traders can keep low of this candle as stoploss.
Let’s see a real-life example:
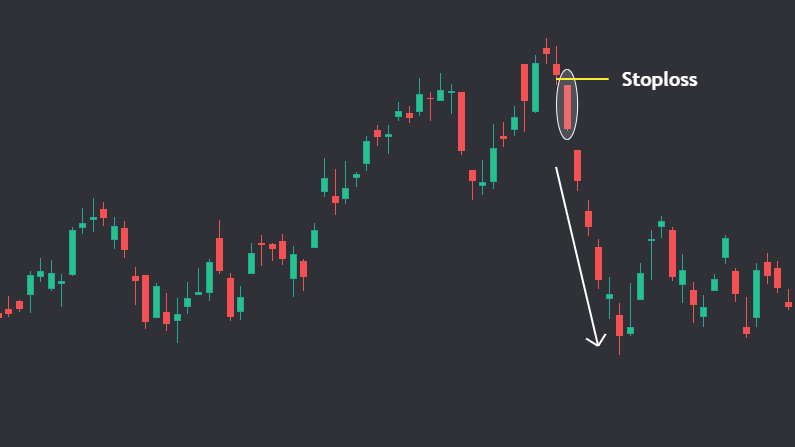
4. Black Marubozu.
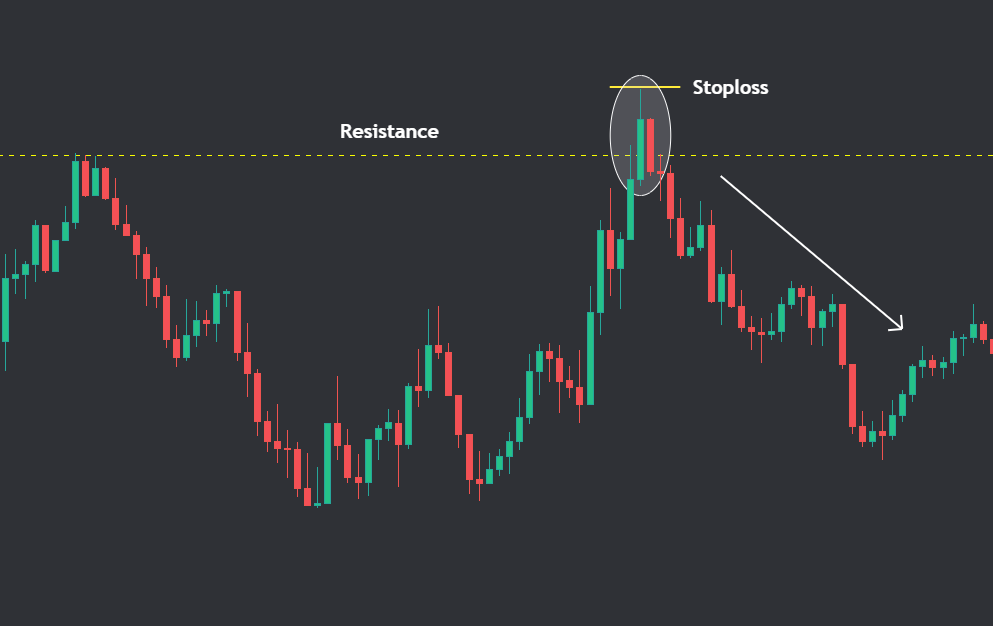
Black Marubozu is a single bearish candlestick pattern and this candle also acts both as a bearish reversal pattern and as a bearish continuation pattern. It is formed when the price opens and directly starts falling without any high formation and directly closes at the low of the day. The body of this pattern is above 90% of the full candle range so a very short wick or no wick at all can be seen in the Black Marubozu candlestick pattern.
A very high-volume Black Marubozu candle is very powerful as it confirms that sellers are creating pressure on buyers. Traders can keep high of this candle as stoploss.
Let’s see a real-life example:
5. Piercing Pattern.
A piercing pattern forms when first a bearish candlestick is formed and then the next candlestick opens with a gap down and then closes above 50% of the body of the previous bearish candlestick.
This pattern is a bullish reversal pattern and forms in the downtrend. The first candle is a bearish candle which indicates a continuation of the downtrend while the second candle is Bullish and signifies that buyers have taken control over sellers.
Traders can look to enter for a bullish trade the next day after a bullish confirmation candle is formed and can keep the low of green candle of piercing pattern as stoploss.
Let’s see a real-life example:
6. Dark Cloud cover.
A dark cloud cover forms when first a bullish candlestick is formed and then the next candlestick opens with a gap up and then closes below 50% of the body of the previous bullish candlestick.
This pattern is a bearish reversal pattern and forms in an uptrend. The first candle is a bullish candle which indicates a continuation of the uptrend while the second candle is bearish and signifies that sellers have taken control over buyers.
Traders can look to enter for a bearish trade the next day after a bearish confirmation candle is formed and can keep the high of the red candle of dark cloud as stoploss.
My observation: Out of all candlestick patterns dark cloud can be seen when there is breakout in stock and next day it gaps up and completes this pattern. A good correction in a bullish stock mostly starts with this pattern.
Let’s see a real-life example:
7. Bullish Engulfing.
Bullish Engulfing candlestick pattern is a two candle pattern that acts as a bullish reversal pattern. The first candle is a red candle while the second candle is a Green candle that covers the entire previous red candle. This signifies that Buyers are dominating sellers. This candlestick pattern mainly occurs in the downtrend.
Higher Volume confirmation on the green candle is needed and low of this green candle can be taken as stoploss.
Let’s see a real-life example:
8. Bearish Engulfing.
Bearish Engulfing candlestick pattern is a two candle pattern that acts as a bearish reversal pattern. The first candle is a green candle while the second candle is a red candle that covers the entire previous green candle. This signifies that Sellers are dominating buyers. This candlestick pattern mainly occurs in an uptrend.
Higher Volume confirmation on the red candle is needed and the high of this red candle can be taken as stoploss.
Let’s see a real-life example:
9. Bullish Harami.
Bullish Harami candlestick pattern is also a two candle pattern that can act as a bullish reversal pattern. The first candle is a red candle while the second candle is a Green candle that is completely inside the range of the previous red candle.
Traders can look for bullish trade only when the high of the first candle is broken and can keep the low of the first candle as stoploss.
Let’s see a real-life example:
10. Bearish Harami.
Bearish Harami candlestick pattern is a two candle pattern that can act as a bearish reversal pattern. The first candle is a green candle while the second candle is a red candle that is completely inside the range of the previous green candle.
Traders can look for bearish trade only when the low of the first candle is broken and can keep the high of the first candle as stoploss.
Let’s see a real-life example:
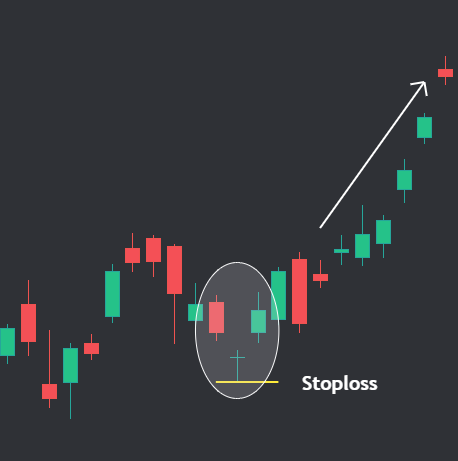
11. The Morning Star.
Morning Star is a three candlestick pattern that occurs mostly in a downtrend and hence it is a bullish reversal candlestick pattern. The first candle is a red candle which shows a continuation of the downtrend. The second candle is a Doji candle which shows both buyers and sellers are in the indecision stage and the third candle is a green candle that shows buyers taking lead and hence changing trends.
A confirmation bullish candle can give confidence about trend change and a low of the Doji candle can be stoploss.
Let’s see a real-life example:
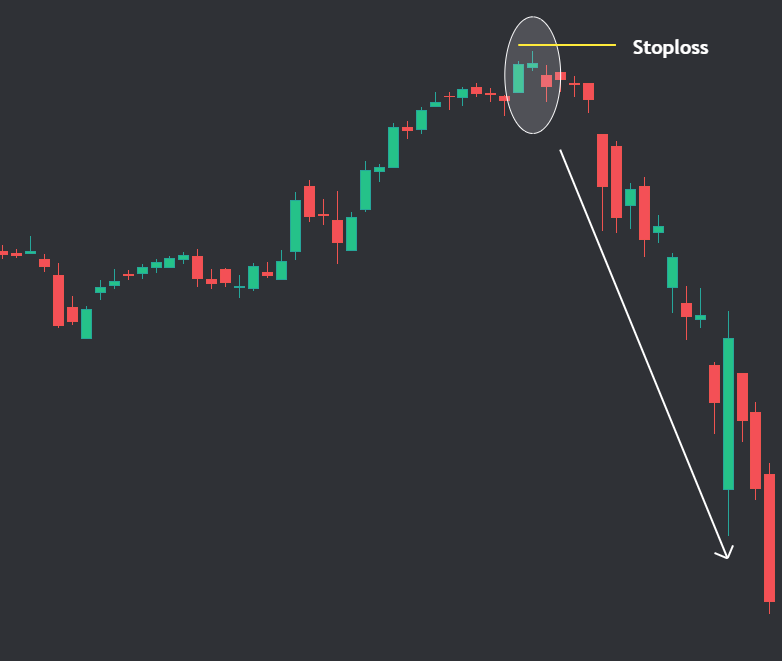
12. The Evening Star.
Evening Star is a three candlestick pattern that occurs mostly in an uptrend and hence it is a bearish reversal candlestick pattern. The first candle is a green candle which shows a continuation of the uptrend. The second candle is a Doji candle which shows both buyers and sellers are in the indecision stage and the third candle is a red candle that shows sellers taking lead and hence changing trends.
A confirmation bearish red candle can give extra confidence about trend change and a high of the Doji candle can be stoploss.
Let’s see a real-life example:
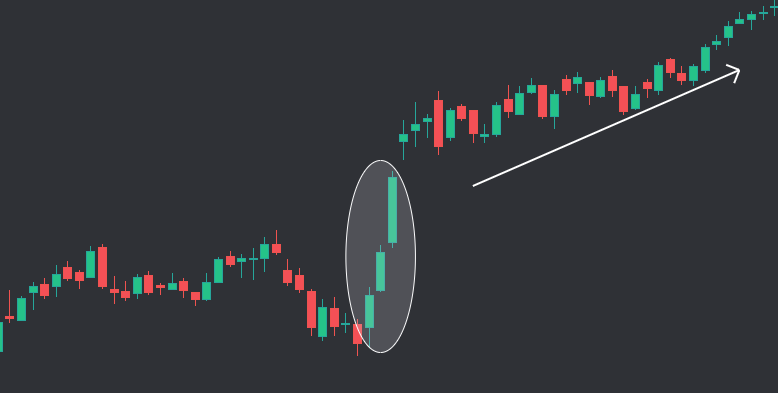
13. Three White Soldiers.
Three White Soldiers is a three candlestick pattern that occurs mostly in an downtrend and hence it is a bullish reversal candlestick pattern. These three candles have little or no wick indicating a very strong buying pressure.
Let’s see a real-life example:
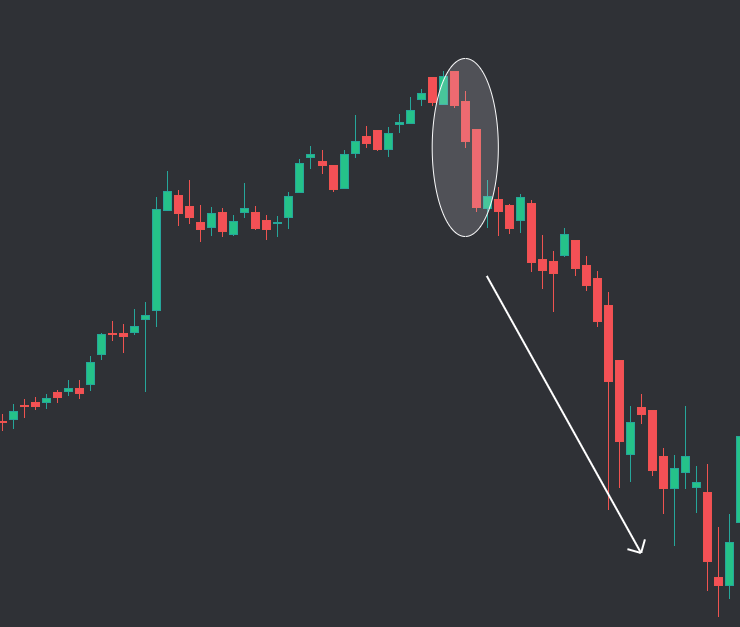
14. Three Black Crows.
Three Black Crows is a three candlestick pattern that occurs mostly in an uptrend and hence it is a bearish reversal candlestick pattern. These three candles have little or no wick indicating a very strong selling pressure.
Let’s see a real-life example:
15. Doji.
Doji is a single candlestick pattern which forms when opening and closing prices are almost same. A doji candles means indecision as both buyers and sellers are fighting equally. It has very small or no body at all as both opening and closing prices might be same.
A solid directional trade can’t be taken just by looking at doji candle as price action can be confusing.
Let’s see a real-life example:
FAQ:
Which candlestick pattern is most reliable?
Piercing Pattern, Dark Cloud cover, Bullish Engulfing, Bearish Engulfing, Morning star and Evening Star.
Do candlestick patterns work?
Only candlestick patterns won’t work. You have to always look for prior price action and combine it with important levels like support and resistance. For example a hammer on support has more chance of working.
How many candlesticks patterns are there?
There are more than 50 candlestick patterns however most traders use top 15 of them only.
What is the most bullish candle?
A Morning star is the most bullish reversal pattern that occurs mostly when bearish trend changes to bullish.
What chart is best for day trading?
Investors mostly use Line chart while Traders mostly use Candlestick chart as it gives more information in a very detailed way.
How accurate is candlestick trading?
Candlestick pattern accuracy depends on location at which it is formed. For example a bearish reversal candlestick pattern forming inside a consolidation zone has no meaning However at resistance it can give a greater accuracy.
What time frame is best for candlestick patterns?
There is no such thing as best timeframe for candlestick patterns. They form on every timeframe however liquidity matters alot if you are checking a very small timeframe. Like in 1m timeframe if there is no or very small volume of trades happening then no proper candlestick will be formed.
Which candle is best for swing trading?
For swing trading Candlestick patterns like hammer, shooting star, piercing pattern and dark cloud cover can work great as they mostly makes breakout fail and can give a good reversal trades.
What do Wicks mean in trading?
Wicks are the vertical lines in candlestick while rectangular part is body of candle.
What do long candle wicks mean?
Upper long wick means that sellers are aggressive while lower long wick means that buyers are dominating sellers.